Mining
Where the World’s Aluminum is Smelted, by Country
![]() See this visualization first on the Voronoi app.
See this visualization first on the Voronoi app.
Aluminum Smelter Production in 2023
This was originally posted on our Voronoi app. Download the app for free on iOS or Android and discover incredible data-driven charts from a variety of trusted sources.
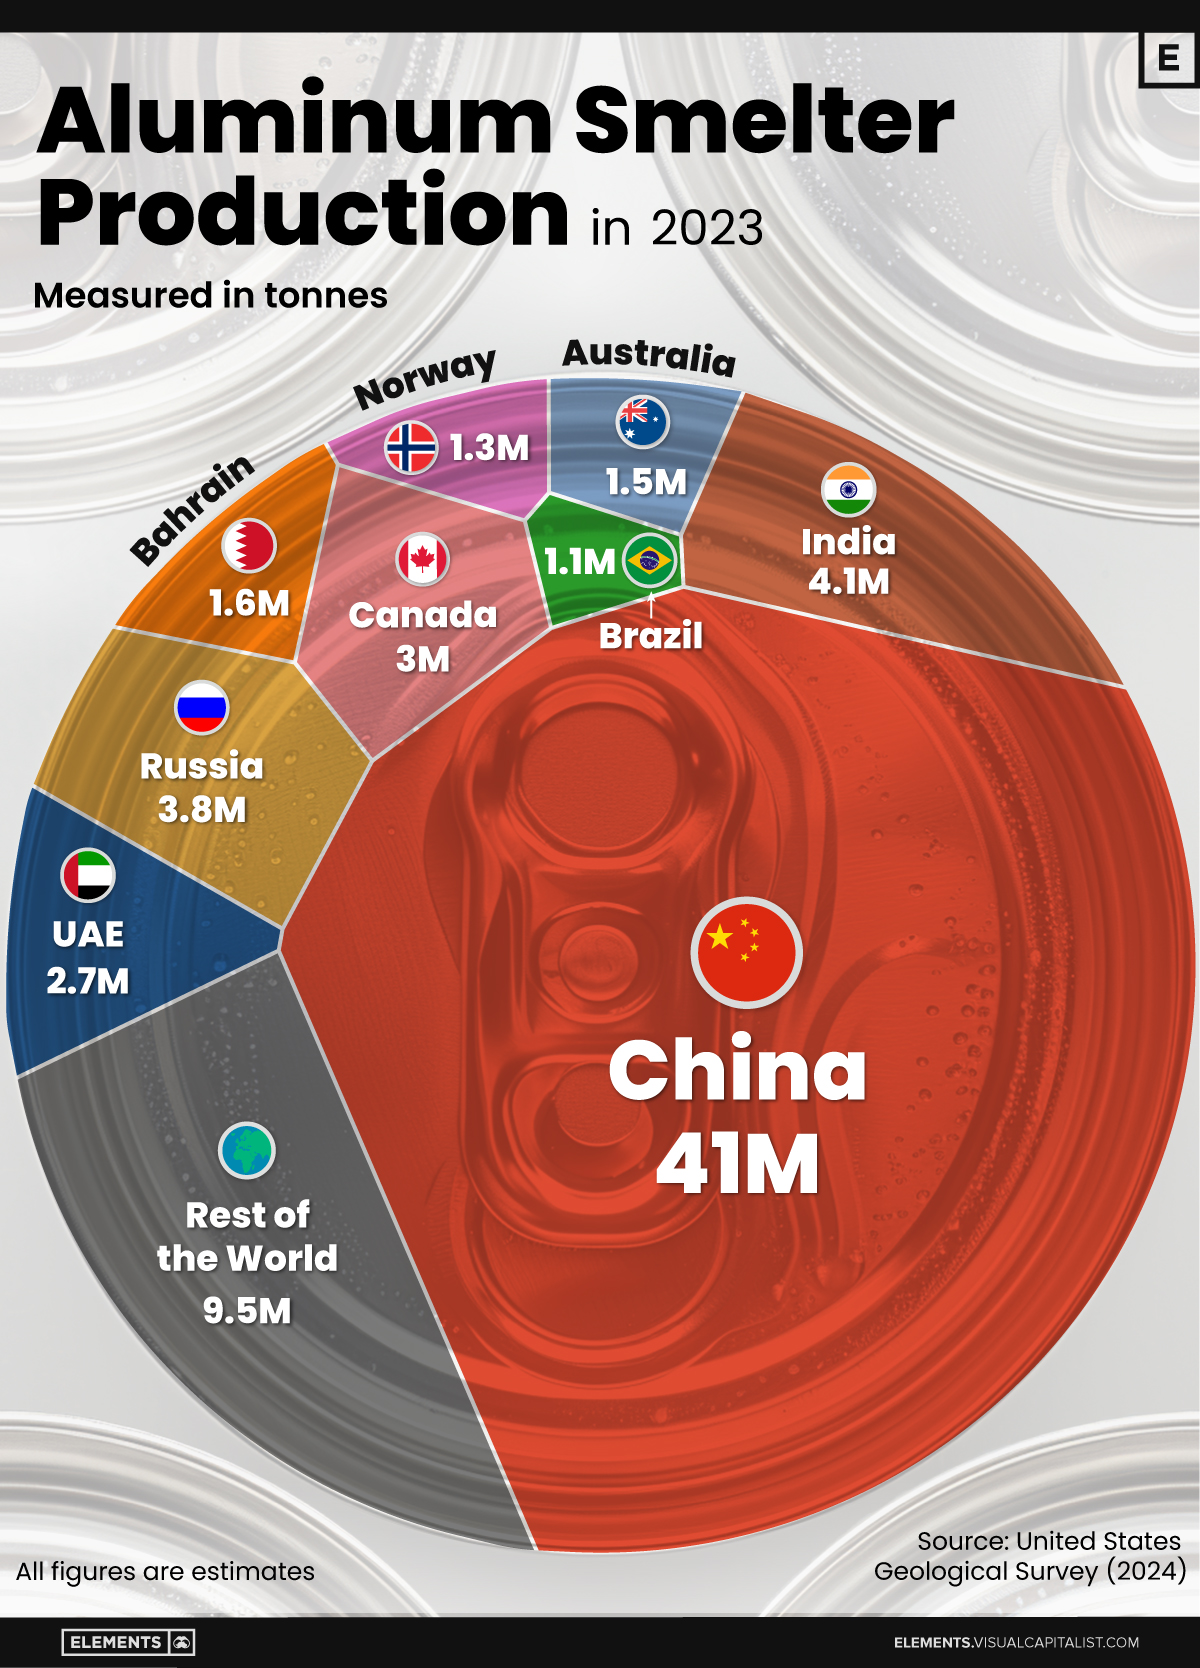
This infographic shows estimated aluminum smelter production by country in 2023, based on data from the most recent U.S. Geological Survey (USGS) Mineral Commodity Summaries, published in January 2024 .
From this data, we can see that China leads as the top producer, accounting for nearly 60% of the world’s smelter capacity. Its neighbor India is the second-largest producer, making only a tenth of China’s output.
| Country | 2023 Aluminum Smelter Production (tonnes) | % of total |
|---|---|---|
| 🇨🇳 China | 41,000,000 | 59% |
| 🇮🇳 India | 4,100,000 | 6% |
| 🇷🇺 Russia | 3,800,000 | 5% |
| 🇨🇦 Canada | 3,000,000 | 4% |
| 🇦🇪 United Arab Emirates | 2,700,000 | 4% |
| 🇧🇭 Bahrain | 1,600,000 | 2% |
| 🇦🇺 Australia | 1,500,000 | 2% |
| 🇳🇴 Norway | 1,300,000 | 2% |
| 🇧🇷 Brazil | 1,100,000 | 2% |
| 🌍 Rest of the World | 9,460,000 | 14% |
| Total | 69,560,000 | 100% |
Responsible for 5% of global aluminum output, Russia has been targeted by recent sanctions from the U.S. and the UK.
The sanctions include prohibiting metal-trading exchanges from accepting new aluminum produced by Russia and barring the import of the Russian metal into the U.S. and Britain. The actions are aimed at disrupting Russian export revenue amid Moscow’s ongoing invasion of Ukraine.
The World’s Most Common Metal
Aluminum is the primary material used for making cans, foil, and many other products. It originates from bauxites, rocks composed of aluminum oxides, and various minerals.
Approximately 25% of annually produced aluminum is utilized by the construction industry, while another 23% is allocated to vehicle frames, wires, wheels, and other components within the transportation sector. Aluminum foil, cans, and packaging constitute another significant end-use category, accounting for 17% of consumption.
Despite its extensive use, aluminum is still plentiful. Aluminum is the world’s most common metal by crustal abundance, making up 8.2% of the Earth’s crust.
According to the USGS, global resources of bauxite are estimated to be between 55 billion and 75 billion tonnes and are sufficient to meet world demand for metal well into the future.


Economy
The Biggest Salt Producing Countries in 2023
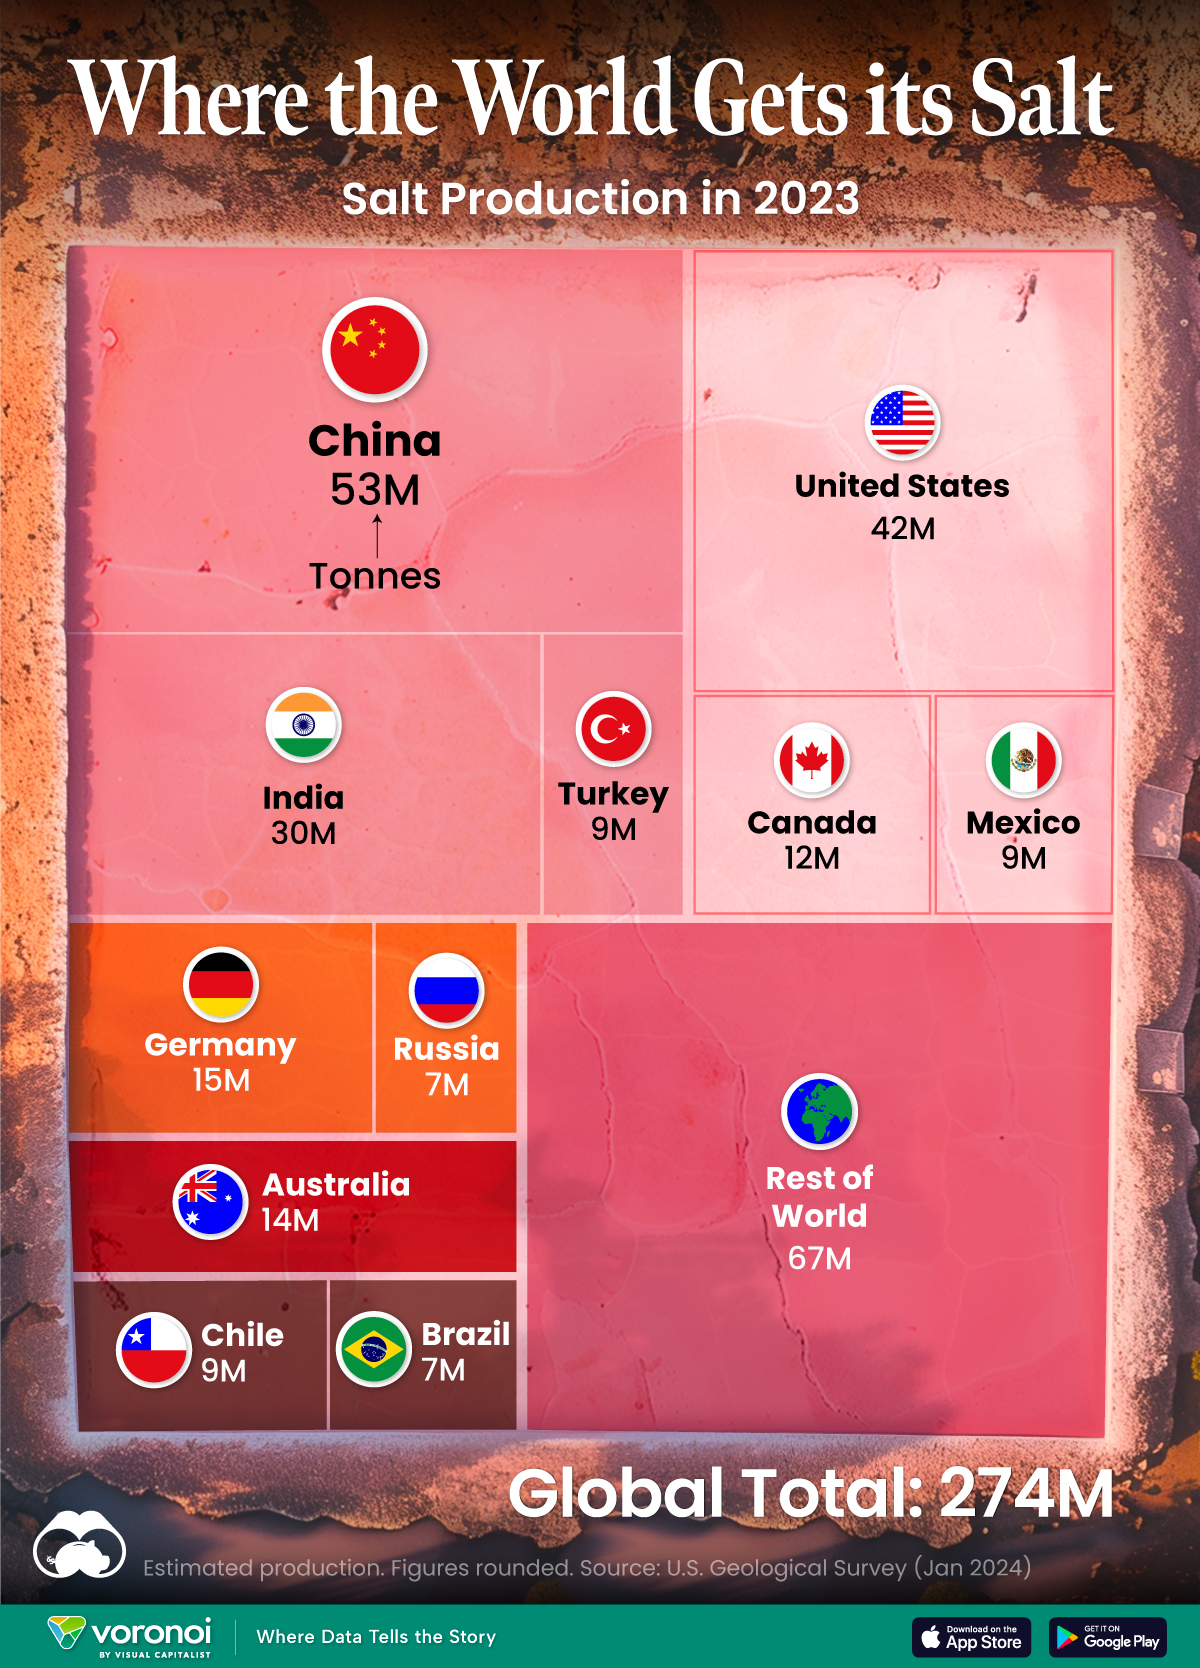
In this graphic, we break down global salt production in 2023. China is currently the top producer, accounting for almost 20% of output.
The Biggest Salt Producing Countries in 2023
This was originally posted on our Voronoi app. Download the app for free on iOS or Android and discover incredible data-driven charts from a variety of trusted sources.
Humanity has utilized salt for thousands of years, dating back to ancient civilizations. The U.S. alone consumes more than 48 million tonnes of salt per year.
In this graphic, we break down global salt production in 2023, measured in tonnes. These estimates come from the U.S. Geological Survey’s latest commodity report on salt.
Ample Supply
Salt is essential for human life, serving various purposes including food preservation, flavor enhancement, industrial processes, and health maintenance. The good news is that the world’s continental resources of salt are vast, and the salt content in the oceans is nearly unlimited.
China is currently the top producer of salt, with almost 20% of the output, followed by the U.S. (15%) and India (11%).
| Country | Production (tonnes) |
|---|---|
| 🇨🇳 China | 53,000,000 |
| 🇺🇸 United States | 42,000,000 |
| 🇮🇳 India | 30,000,000 |
| 🇩🇪 Germany | 15,000,000 |
| 🇦🇺 Australia | 14,000,000 |
| 🇨🇦 Canada | 12,000,000 |
| 🇨🇱 Chile | 9,200,000 |
| 🇲🇽 Mexico | 9,000,000 |
| 🇹🇷 Turkey | 9,000,000 |
| 🇷🇺 Russia | 7,000,000 |
| 🇧🇷 Brazil | 6,600,000 |
| Rest of world | 67,000,000 |
| Global total | 273,800,000 |
The global salt market was valued at $32.6 billion in 2022.
It’s projected to grow from $34.1 billion in 2023 to $48.6 billion by 2030, with a CAGR of 5.2% during the forecast period. This suggests a surprising amount of growth for what is one of the world’s oldest and most common commodities.
Facts About the U.S. Salt Industry
In the U.S., salt is produced by 25 companies, which operate 63 plants across 16 states.
The states that produce the most salt are Kansas, Louisiana, Michigan, New York, Ohio, Texas, and Utah. Altogether, these states account for 95% of domestic production.
The primary uses of salt in the U.S. are highway de-icing (41%), chemical production (38%), and food processing (10%).

-

 United States5 days ago
Mapped: Countries Where Recreational Cannabis is Legal
-

 Technology2 weeks ago
Mapped: The Number of AI Startups By Country
-

 Healthcare2 weeks ago
Life Expectancy by Region (1950-2050F)
-

 Markets2 weeks ago
The Growth of a $1,000 Equity Investment, by Stock Market
-

 Markets2 weeks ago
Mapped: Europe’s GDP Per Capita, by Country
-

 Money1 week ago
Charted: What Frustrates Americans About the Tax System
-

 Technology1 week ago
Countries With the Highest Rates of Crypto Ownership
-

 Personal Finance1 week ago
Visualizing the Tax Burden of Every U.S. State